
NZDUSD Trade Idea (Sept, 2020) BIG SHORT?
- Matty Cheung

- Sep 8, 2020
- 7 min read
Is the double dip recession going to hit earlier than expected? Let’s take a look and see. Last month I did an analysis on NZDUSD with the New Zealand Banking Group one of the largest banks there signalling a potential double dip recession. We’ve checked our indicators to see what’s going on behind the scenes with fundamentals and found some really interesting signs.

Professional forex traders will always start their analysis off by looking at the fundamental data. That’s why we’re scanning over our Macro Currency Strength Meter to see on an economic level how strong or weak should the NZDUSD currency pair be. You can see the blue line being NZD and the purple being USD. NZD has shown to fall from +8 all the way now down to -20 over the past month! This is starting to confirm our idea last month that we may be ready for a short on NZDUSD. Similar things are happening with USD but in the past week USD has started to strengthen on our indicator. This means we can focus on the currency pair NZDUSD after checking the strength indicator here at Logikfx.
Now that we know to focus on NZDUSD we need to compare their data points to see relatively should we be shorting NZDUSD.
Gross Domestic Product Differential NZDUSD
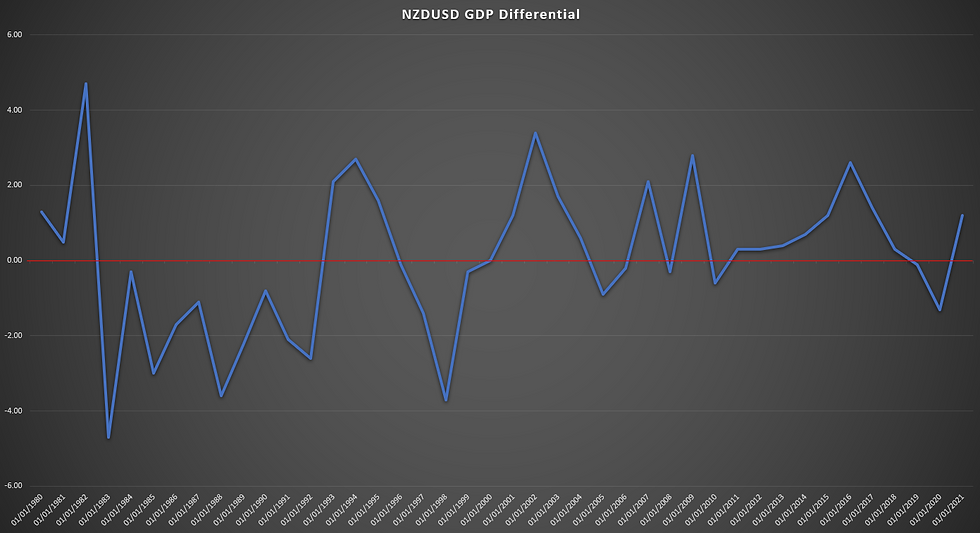
Again we’re considering the GDP differentials as a starting point. Even though it’s lagging in nature we still want to see what’s been happening in the economy and what the potential forecasts are. Currently the GDP differentials are sitting in a negative region this means New Zealand is growing at a slower rate than the U.S. or contracting more than the U.S. so in the current climate we should be short. However, the forecasts made by the IMF have suggested a potentially higher growth in New Zealand with a differential of around 1.2% which could signal a future long bias. Realistically, the economic outlook is still very uncertain and with a big portion of GDP coming from tourism in New Zealand that part of the economy isn’t going to pick up anytime soon.
A2 Milk Analysis NZDUSD

We’re going to be using the same indicators as our previous post with one addition this time round. As always we’ve included in the trade idea A2 Milk in the analysis for NZD because when you actually analyse the trading partners of New Zealand one of their biggest exports is dairy products. Including one of the major exports is always useful to consider future exchange rates.
The A2 Milk still holds a 65% negative correlation mainly due to how much A2 milk as grown in the past 5 years. So we follow the same principles as before which are when A2 milk increases in value we can expect NZD to fall in value and vice versa. However, if we inspect the last month of data we can see A2 milk fall. This is not great for our short idea and to be really confident we’d expect A2 to rise in value but we’re still going to continue with the analysis to see what the other indicators have to say about NZDUSD.
Steel & Tube Holdings Ltd (STU) Analysis
Steel & Tube Holdings Limited is a New Zealand-based company, which is engaged in the distribution, processing and fabrication of steel and allied products. One of New Zealand’s top manufacturers of these construction based products.

You can see from the chart behaviour and mentioned in past results that there’s an opposite correlation this time round. Over the past 10 years we’ve had a positive correlation of 68% which shows accurate 68% of the time as STU falls so did NZDUSD and when STU rises so did NZDUSD. There’s no surprise that currently STU is it very low levels with COVID having major impact on businesses and future orders. However, this is actually good for our short idea on NZDUSD with STU falling value the past month it’s further pushing confidence in the short idea for NZDUSD. Great, we can tick this one off as ready.
West Texas Intermediate (WTI) Analysis NZDUSD

West Texas Intermediate (WTI) is a crude oil which is a main global oil barometer. It’s essentially the price of oil itself so what we’ve done is include it within the analysis due to the U.S. being a major exporter and importer of oil itself. Very interesting data is shown on this correlation. Do you not think WTI and NZDUSD look almost identical? There’s no surprise over the past 10 years of data we’ve had a 82% positive correlation! So 82% of the time as oil goes up so does NZDUSD and when oil goes down NZDUSD follows! What we’ve had in the past month is Oil prices starting to take a dip again which is interesting as this agrees with our NZDUSD short idea. So we can straight away tick this off our analysis as ready and get on with the next indicator to analyse.
Exxon Mobil Analysis NZDUSD

Now that we’ve analysed the Crude oil prices which is WTI we actually want to take a look at the refined oils industry. So we’re analysing Exxon Mobil as the supply a large portion of the worlds refined oil and consumers in the United States. Here we get an interesting gauge on refined oil prices. Similar to crude oil we have a positive correlation with a 64% positive correlation and if you follow the orange line which is Exxon prices it has high predictive value on NZDUSD.
The last month has shown Exxon take another dip falling to similar levels during COVID-19 lockdown. This shows that Exxon is potentially becoming less profitable and investors sell their stakes in the company. This therefore agrees with our NZDUSD short idea so we can tick it off as ready! So, far it’s looking quite good for our short idea and honestly, I’m ready on this. We just need to take a look at interest rates and overall stock performance to gauge how rich or poor each country is.
Interest Rate Differential Analysis

Interest rates are always one of the key indicators when assessing currency rates as it is a major indicator for investors sentiment and where they want to put money. E.g. for their bonds or carry trades.
As mentioned in the previous post, global interest rates are getting very low as central banks have used the monetary lever to its full potential. Now that most interest rates are close or at zero their only option now is printing money. Currently, we have the interest rate differentials sitting at 0% so we’re actually scored it quite neutral. Ideally we want the differential to be falling like it has over the past 5 years but interest rates are likely not to change until central authorities struggle with inflation.
NZX50 Stock Index Performance

We’ve now nearly completed our fundamental analysis on NZDUSD. All that’s left is checking the stock performance of the country which is the NZX50 index. We’ve priced it in USD to see in comparison the United States how well are they actually performing. Since March the index took a steep fall and since recovered mostly. However, most recently we’re seeing the index flatten out as it reaches pre-covid levels. Here we may see the index drop again if businesses continue to be uncertain on future outlooks and consumer confidence not back to where it was.
Luckily, we can tick this off as ready for our short idea moving forward due to the -2.5% performance since its most recent highs. Now that we’ve finished the fundamental analysis side of NZDUSD we want to analyse market sentiment and then check price data to see if sellers are coming in.
Commitment of Traders (COT Report Forex Analysis)
Here at Logifkx we always want to be patient on our ideas and wait for the market to agree with it to limit our downside. The main tool we use is our COT indicator to track hedge funds on what they are buying or selling. Here we’ve chosen NZD and USD to monitor sentiment, if you want to learn how to do this COT analysis yourself and create this indicator click here. Else, lets continue with the analysis.


What is the COT data actually saying for NZDUSD then? Well, for the NZD we have the open interest in a negative region but it’s rising. This means hedge funds are selling the NZD which is good but they’re reducing their shorts which isn’t great. BUT, on the flipside we have hedge funds go from selling the USD to actually buying it! This means on a sentiment level we are actually ready which is rare. So we can tick this off as ready.
NZDUSD Price Analysis

Due to the nature of fundamentals and trading over longer time periods to capture bigger moves we’re going to be analysing the weekly and daily levels. This lines up with our COT sentiment and also the fundamental monthly data.
On a weekly level we’ve had a slight price rejection since last weeks analysis. We then saw a large green bullish candle push price higher but again we’re seeing a solid weekly evening star formation which means sellers are coming in right now. You can see on the chart above I’ve highlighted the levels at which sellers pushed buyers back to much lower levels and we’re at those levels right now. This is good and we’re now really looking at areas to get in.

The daily time frame has interest signs of bearish candles forming with a strong force. However, we’re not out the safe zone yet. We need the sellers to break the lows made in August then potentially have a pullback to get in on and continue to downwards trend. Until we see those lower lows and lower highs we should be wary.
Due to the high volatility of NZDUSD we’re looking at about a 5% stop loss and 15% target. Easily set your stops with our ATR calculator.
Learn to trade with Logikfx Academy
Take the first steps into growing your value as a trader with our free online courses, webinars, seminars. All from a small team of highly skilled traders with over 15 years’ experience in the financial markets. Learn how to use powerful tools such as the macro currency strength meter alongside market positioning through a step-by-step COT tutorial - all at your own pace, including interactive exercises, engaging examples, and full support to help you develop your understanding.
Unlock Premium Trade Ideas
Get all the hard work done for you and gain access to high-quality trade ideas directly from Logikfx for the upcoming weeks and months.
Useful Reads:
Our Currency Strength Meter: https://www.logikfx.com/currency-strength-meter
How to make money trading forex: https://www.logikfx.com/post/how-to-make-money-trading-forex
Forex Trading Journal: https://www.logikfx.com/post/the-ultimate-trading-journal
How to set stop losses properly: https://www.logikfx.com/post/how-to-use-average-true-range-atr-for-stop-losses-and-take-profits


Comments